Frequently Asked Questions: Budget
We’d like to take this opportunity to provide context and further explanation of some key elements of the budget, and respond to some of the themes we’re hearing through various forums throughout the community.
Budget Explained
-
What municipal property tax increases are we facing?
At the April 25, 2013 Special Council Meeting, Council passed the first three readings of the budget bylaw. The following chart reflects the recent changes made to bring down the average Residential assessment to a 10.2% increase and the average Business assessment to a 10.4% increase. Actual increases will vary by property owner based on their change in assessment base from 2012 to 2013.
Average
IncreaseResidential Assessment 10.2% $160/yr, $13/mo Average single family dwelling 9.0% $182/yr, $15/mo Average residential strata unit 9.7% $120/yr, $10/mo Utilities 1.4% $322/yr, $27/mo Major industry (Port) 1.8% $6,573/yr, $548/mo Light industry 16.8% $810/yr, $68/mo Business assessment 10.4% $560/yr, $47/mo Forests-managed -85.4% -$32,991/yr Recreation/N.P -26.5% -$238/yr Farm -90.4% -$358/yr *Each property owner will be impacted differently depending on the change in assessment of their property.
-
Why is the tax burden so heavily weighted to Residential and Business?
Residential makes up 85% of the total tax base in Squamish, and is responsible for 62% of the property tax burden.
Business makes up 13% of the total tax base, and is responsible for 26% of the property tax burden.
The remaining 2% comprises of the remaining Property Classes: Utilities, Light Industry, Major Industry, Managed Forests, Recreation/Non-profit, and Farm. These classes are responsible for the remaining 12% of the property tax burden.
-
I thought the tax increase was being considered at 10% according to previous news reports?
The 10.1% increase previously referred to is the increase in property tax revenue required for an 11.7% overall budget increase over 2012, minus the overall non-market change in assessment base of 1.6% (i.e. growth among various property classes within the assessment base).
Due to distribution of that growth, and legal and policy caps on most policy classes, the change for each individual property class varies.
-
What is the dollar cost equivalence of a 1% increase in property taxes?
A $200,000 increase in expenses has an approximate impact of a 1% increase in property taxes.
-
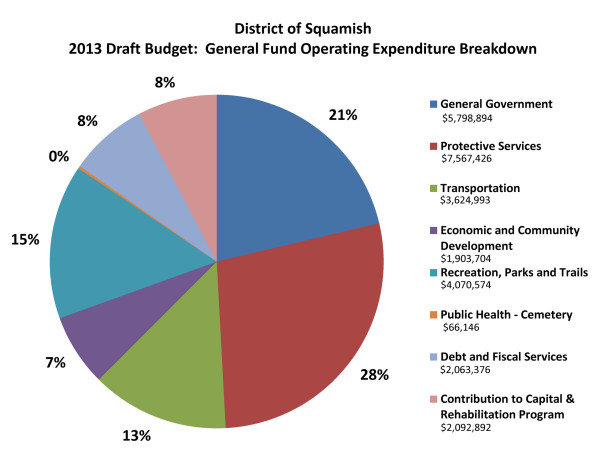
What is the municipal operating budget comprised of?
-
How is the "General Fund" broken down?

2013 Budget Drivers
-
What are the general guiding principles behind this budget increase?
- Contribute to capital projects and reserves to rehabilitate and renew aging infrastructure.
- Reduce reliance upon debt to fund capital renewal.
- Reduce reliance on savings to fund special projects.
- Phase in RCMP cost sharing (increased from 70% to 90%) over four years.
- Phase in labour cost changes with money set aside for this purpose.
- Meet service expectations as determined through the Squamish Service Initiative (2010), and Core Service Reviews implemented 2010 through 2013.
- Meet Council’s strategic priorities.
- Maintain core service delivery.
-
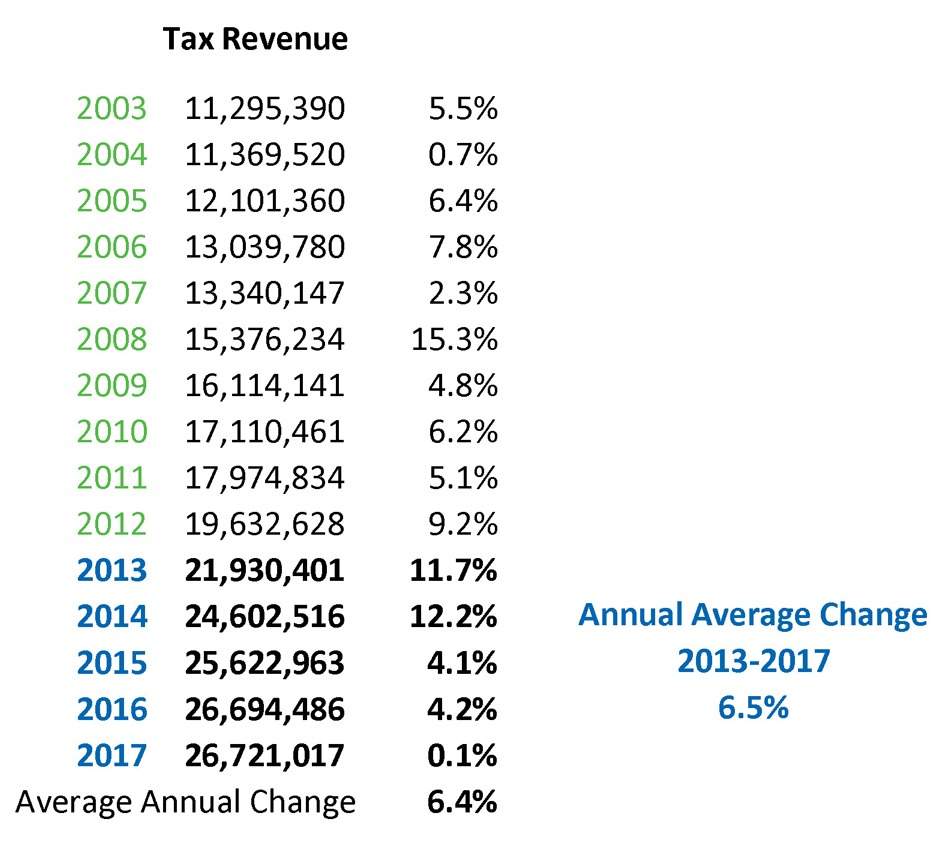
How have property taxes increased in the last 10 years?
Click chart to enlarge.

Core Service
-
What does “core service” mean?
Core services that the District provides include:
- General Government:
- Legislative Services
- Communications
- Facilities
- Information Services
- Real Estate Services
- Financial Services
- Human Resources
- Library
- Protective Services:
- Policing
- Squamish Fire Rescue
- Emergency Management
- Bylaw Enforcement
- Animal Control
- Building Inspection
- Transportation and Transit Services:
- Engineering
- Public Works - Roads, Snowclearing, Drainage, Sidewalks and Bridges
- Transit
- Economic and Community Development:
- Community Planning
- Environmental Planning
- Economic Development
- Recreation, Parks and Trails:
- Recreation Services
- Parks and Trails
- Public Health (Cemetery)
- Solid Waste Utility:
- Garbage, Recycling, Yard Waste Collections
- Landfill Operations
- Water Utility:
- Treatment
- Supply
- Distribution
- Pumping & Power
- Sewer Utility:
- Collection
- Treatment and Disposal
The ‘core’ budget, as referred to in the budget process, relates to the cost of maintaining existing service levels as were provided in 2012. This excludes special projects and new initiatives.
Through the ‘pursuit of excellence in government’ philosophy introduced with the Service Squamish Initiative, District managers review programs and budgets annually in preparation for the coming year to maximize efficiencies and identify opportunities for cost sharing, partnerships etc.
Periodic and ongoing Core Service Reviews will continue to take place to ensure departments remain “right-sized” to meet the service demands of the community, as well as to ensure efficiencies and improvements are continuously sought.
-
What efforts does the District of Squamish employ in order to find efficiencies?
Since 2010, the District of Squamish has been implementing the Service Squamish Initiative. Core Service Reviews have been undertaken for every business unit within the District.
The Squamish Service Initiative:
- Fundamentally changed how the District works to achieve excellence in government.
- Created a culture of proactive examination to find efficiencies and increase effectiveness in delivery of services.
- Involved significant research and consultation.
- Shifted and transformed the organization to a higher performance level.
Systematic evaluations of the District’s business units took place over a one to three month period and reviewed:
- Service levels – current and best practices
- Staff organization and structure
- Staff efficiency
- Staff morale
- Opportunities for alignment with other business units
- Financial strengths and weaknesses
Recommendations were provided to:
- Improve performance
- Balance service levels
- Streamline/combine processes
- Improve morale
-
Can I view the Core Service Reviews online to learn how efficiencies and savings have been found since 2010?
Yes. Core Service Review reports are available for viewing on our website.
Reviews have been completed, and recommendations implemented for:
- Corporate Services
- Recreation Services
- RCMP Support Services
- Planning, Building, Environment & Trails Services
- Operations Department
- Engineering & Parks
- Information Services
- Fire Rescue (completing 1-2 months)
- Human Resources (ready for presentation to Council)
-
What kind of efficiencies and improvements have the Core Service Reviews resulted in across the business units?
The Core Service Reviews incorporated large scale public consultation to determine the type/level of service the community was seeking in certain areas. For example:
- Recreation Services gathered 800 survey responses.
- Development Services conducted over 100 individual interviews with community stakeholders, developers and employees.
Results from the Core Service Reviews include:
- Overall shift in culture to adopt a District-wide customer service philosophy.
- New Development Services front counter to improve customer service.
- Significantly shorter turn-around times on everything from business licenses to building permits and inspections (i.e. Building Permits from +/- 4 months to average +/- 2 weeks.
- Ongoing introduction of online processes and forms across various departments.
- Overhaul of Development Permit application process.
- Reduction in overtime hours logged in Operations - OT only used for core services Fire and Utility Ops.
- New communications focus – new web site, social media tools.
- Online processes introduced for field and ice users at Brennan Park.
- Stabilization of IT infrastructure = reduction in costs and improved service delivery.
- Improvements in statutory responsibilities such as records management.
- Restructuring of municipal staffing i.e. administrative component of RCMP.
- Completion of the Parks & Recreation Master Plan.
- Brennan Park facility improvements.
- Creation of the Artificial Turf Field, Stan Clarke Park upgrades, and various other playground/park upgrades throughout community.
-
Can core services be cut?
Cuts can always be made. However the question is where does the community want to see cuts?
Through extensive public input into our operations through surveys (i.e. 800 survey responses for the Recreation Services Core Service Review), constant requests for services, and the demand for the District to take a greater role in such areas as economic development, building and planning services, trails and parks, we hear that the community wants more from District staff, not less.
DOS Staffing
-
How many staff does the District employ? Have staff numbers increased significantly over recent years?
Squamish is growing!
Click graph to enlarge.
How is District staff growing to meet the increasing needs of the population?
The District employs staff in the following general classifications – full-time, part-time, seasonal and casual.
The best way to measure the increase in staff is to measure by “Full Time Equivalents” (FTEs). This figure incorporates all the above classifications (full-time, part-time, seasonal, casual), and provides a figure that measures these employees as if they were combined together to represent full-time staff. For example, two part-time staff each working 20 hours equals one Full Time Equivalent or FTE.
The number of FTEs have increased by 3.8% since 2007.
Click graph to enlarge.

- Overtime has been reduced as a result of the Core Service Reviews and the slight increase in FTEs, resulting in an anticipated 91% decrease in overtime since 2007.
Click graph to enlarge.

- A major decrease in overtime was logged in 2010 due to the execution of the Core Service Reviews and the subsequent implementation of recommendations and finding.
- Overtime is budgeted only in essential services such as Fire Rescue and Utility Operations.
-
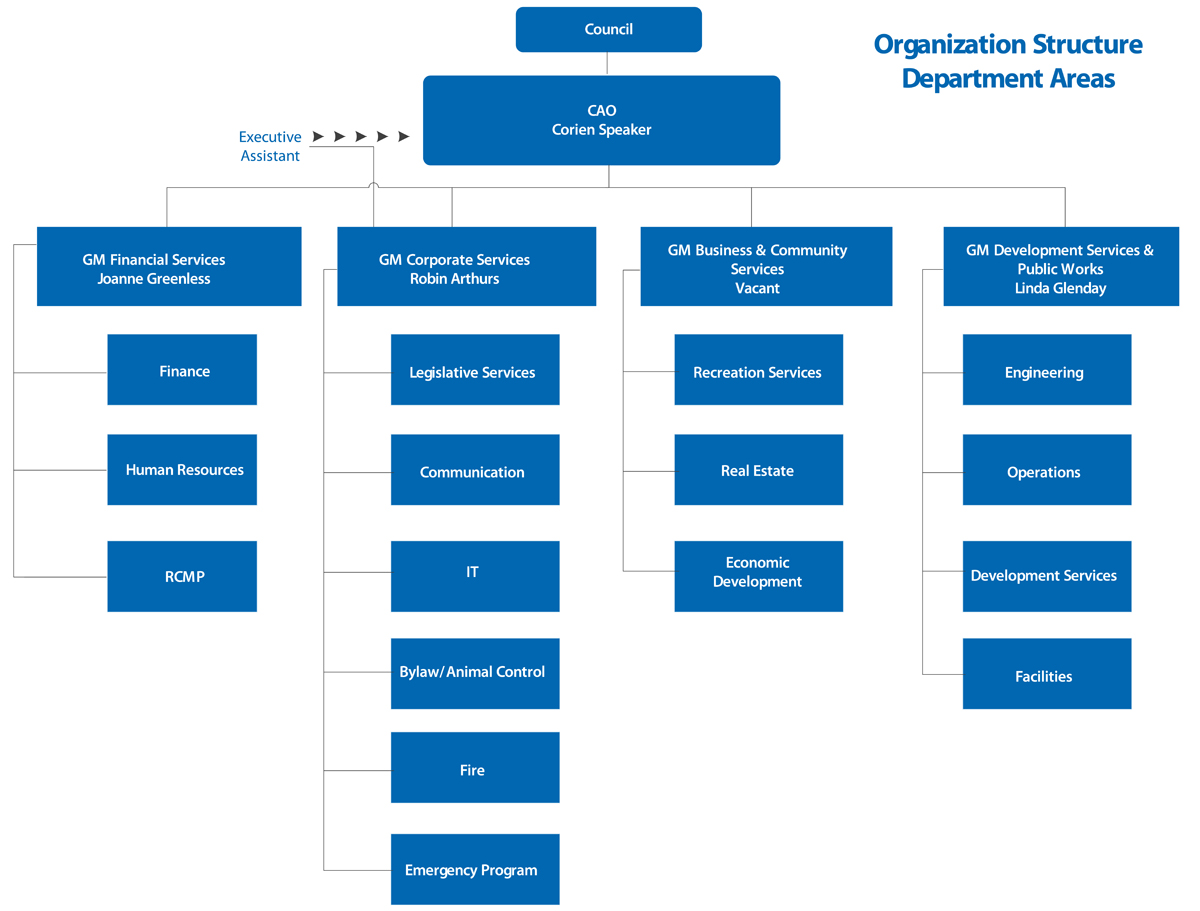
What is the ratio of DOS management to staff, and how has this changed in recent years?
- The District of Squamish employed 24 managers in 2007, and 24 managers in 2013. In 2013, this comprises of 13% of total staff.
- The percentage of management (13%) to non-management (87%) has dropped slightly since 2007 as the number of non-management employees has increased slightly.
- This management group includes the Chief Administrative Officer and four General Managers.
- The following chart highlights the organizational structure of District of Squamish management.
Click chart to enlarge.


Miscellaneous
-
It has been said that the District of Squamish doesn’t run like a business. What does that mean?
Businesses are ‘for profit’, and therefore implement initiatives solely to make a profit.
Local Government provides services for the community that do not necessarily have revenue sources to cover the total cost of the service. Such services are designed to improve the quality of life that is available to be enjoyed by all residents. The degree to which user pay is applied is a matter of policy, and establishes a base for delivery of services considered essential for all residents. Although Local Government may choose to implement user fees for some optional services, they’re often subsidized by taxation to make them affordable for all residents.
Services that charge a user fee range from levying nominal fees to full recovery. Such services include recreation, ice arena, libary, planning services, building services, water, sewer and solid waste.
Through the 2010 Service Squamish Initiative and Core Service Reviews, the District has adopted a philosophy of achieving government excellence through efficiencies in operations. At the core of all decisions and spending is to understand what the business case is for that particular initiative.
-
How much does the Adventure Centre cost taxpayers per year?
$153,500 annually is contributed toward the Adventure Centre's operation and upgrades.
2013 will see an additional $52,000 spent on building maintenance and upgrades to increase the energy efficiency of the building and protect the District's asset.
The Adventure Centre provides space for the Visitor Information Centre and leases space to Tourism Squamish, Chamber of Commerce, a coffee shop and souvenir store.